There is an inbuilt ability for gdb to also debug programs that reside in remote machines using a gdb-specific protocol. The remote machine is connected to the host via a serial line, or through a port. This remote connection is called a gdb proxy.
While inside gdb, give as:
(gdb) target remote localhost:2000
This would enable gdb to perform all debugging operations on a program connected to the localhost machine through the port 2000.
There is a prerequisite that the machine that is to be present in the same port must have set permissions for an external debugger.
Sample Program
 |
| Fig 1. Sample program - led1.c |
This sample program named 'led1.c', is only used to demonstrate remote debugging.
The Preparation
Connect the LaunchPad to the system. Now the sample program is cross-compiled, and downloaded into the LaunchPad.
For further details, refer:
switching-on-launchpad-leds.html
For necessary reasons, I am calling the current terminal, "Terminal1".
The 'mspdebug' has a built-in command that enables it to run a GDB remote stub on a specified TCP/IP port. If no port is specified, 2000 is taken as default.
Give as:
(mspdebug) gdb
A message will be displayed as:
Bound to port 2000. Now waiting for connection...
At this time, open another terminal. I'm calling it "Terminal2".
In Terminal2, give as:
msp430-gdb -q a.out
Here, 'a.out' is the LaunchPad-specific executable binary obtained by cross-compiling the above sample program.
Now, connect to the remote machine already waiting in port 2000 as:
(gdb) target remote localhost:2000
An acknowledgement message will be displayed as:
Remote debugging using localhost:2000
0x0000fc00 in _reset_vector__ ()
If you check back in Terminal1, messages similar to the following will have been displayed:
Client connected from 127.0.0.1:47558
Clearing all breakpoints...
Reading 2 bytes from 0xfc00
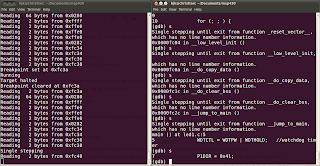
The current states of the two terminals is as shown:
 |
| Fig 2. Terminal1 (left side) and Terminal 2 (right side) |
On listing 'led1.c' in Terminal2, the memory addresses from which the bytes are read will be displayed in Terminal1, simultaneously.
 |
| Fig 3. Listing the sample program |
 |
| Fig 4. Single stepping through runtime libraries |
On further single steps from this point, the runtime libraries through which the control passes until main( ) is reached, can be observed directly !!!
Notice that a considerable number of bytes have been read.
Now, single step till the instruction 'P1OUT = 0x01' is reached.
Notice that a considerable number of bytes have been read.
Now, single step till the instruction 'P1OUT = 0x01' is reached.
The Action
At this point, the next single step will cause it to execute, which will pass a high voltage (binary 1) to the red led on the LaunchPad, i.e., do it, and see the red LaunchPad led (P1.0) flash bright !!!
On next step, a binary 0 is passed to P1.0, causing it to be off.
Single step again, and see the green LaunchPad led (P1.6) flash before your eyes !!!
Turn it off too, and keep on single stepping, until you relish the wonderful thing thats happening infront of you ... This is GDB at its best !!!
At all these points, the memory addresses from which reading takes place are displayed in Terminal1.
N. B.
- Properly exit from both mspdebug in Terminal1 and GDB in Terminal2, before disconnecting the LaunchPad from the system.
- Exit from GDB in Terminal2 first, and then mspdebug in Terminal1.
Addendum
It was one of the cutest moments, to actually 'see' GDB in work.
I am crazy on LaunchPad !!!
No comments:
Post a Comment